SmartGuard™ Auto Mode sensor graph
Device: MiniMed™ 770G insulin pump
Your Auto Mode sensor graph displays your current sensor glucose (SG) reading that is wirelessly sent to your pump by your transmitter.
To view the sensor graph:
Press the Graph button to display the sensor glucose graph.
Press Up to navigate to the 6-hour, 12-hour, and 24-hour graphs.
Press Left to view the sensor glucose readings and event details.
To exist the full-screen view, press the Back or press the Graph button again.
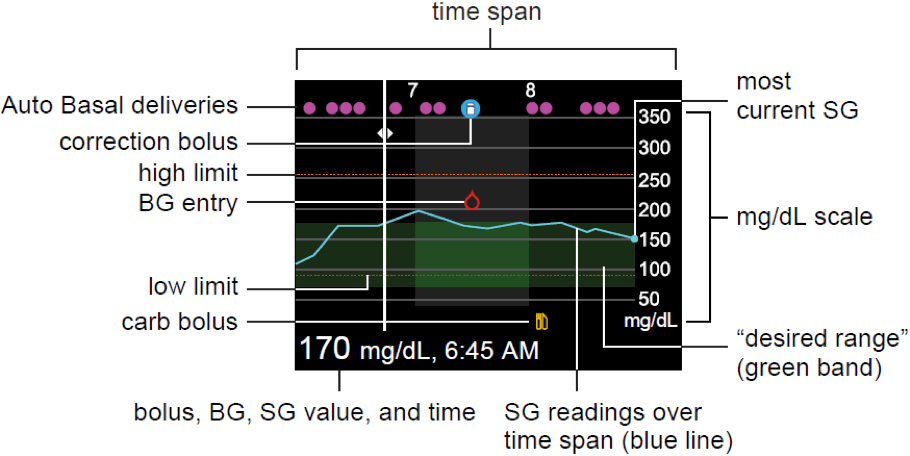
The Auto Mode sensor graph includes the following information:
- The bolus amount, BG, SG value, and time are displayed at the bottom of the screen.
- When you select a location on the graph, the specific details of the SG or event appear. Each Auto Basal delivery is displayed as a separate event rather than a delivery in units per hour. In addition, it is labeled as “Basal.” For example, “Basal, 0.225 U” means 0.225 U was fully delivered at that time.
- Historical SG readings are displayed for the last 3-hour, 6-hour, 12-hour, or 24-hour periods. They appear as a blue line across the screen.
- Correction boluses are shown as white vials inside blue circles.
- Meal (carb) boluses are shown as yellow knife and fork symbols. These represent any bolus amounts that include a carb entry.
- BG entries appear as red drop symbols.
- The numerous small magenta dots along the top represent the automatically delivered basal insulin (Auto Basal or Safe Basal) delivered by SmartGuard™ Auto Mode.
- A time change event appears as a white clock symbol.