Reading your sensor graphs
Device: MiniMed™ 770G insulin pump
Once the sensor has started giving you sensor glucose readings, the Home screen shows your readings in a way that is similar to the examples shown below.
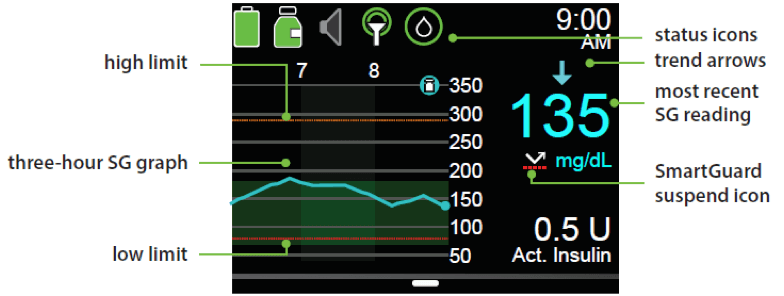
Manual Mode Sensor Display:
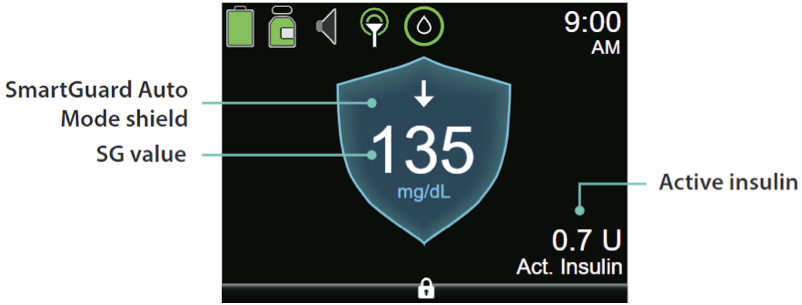
SmartGuard™ Auto Mode Sensor Display:
Status Bar
In addition to the pump icons, you will see additional sensor icons on the Status Bar when using CGM.
| Icon | Icon name | What it means |
|---|---|---|
 |
Sensor life | The number in the center of the sensor life icon indicates the number of days that remain until the sensor expires. The icon appears only when the Sensor feature is turned on. When you insert a new sensor, the icon color is solid green. When one day remains until the sensor expires, the icon color turns red. If the number of days that remain until the sensor expires is unavailable, the sensor life icon appears with three dots. When the system is waiting for the sensor to be started, the sensor life icon appears with a question mark.
|
 |
Calibration | The approximate time left until your next sensor calibration is due. Appears only when the Sensor feature is turned on. The color and the circle around the icon indicate the status. When your sensor is fully calibrated, the icon has a solid green circle around it. As the time for your next sensor calibration approaches, the green circle around the icon becomes smaller, and the color of the icon changes as shown in the following example.
|
 |
Connection | Appears green when the Sensor feature is on and your transmitter is successfully communicating with your pump. The connection icon appears with a red X when the Sensor feature is turned on, but the transmitter is not connected or communication with your pump has been lost. |
 |
SmartGuard™ suspend | Appears only when either the Suspend before low or Suspend on low feature is set to on. The SmartGuard™ suspend icon indicates the current status of the suspend features, as follows:

|
 |
Trend Arrows | Shows the rate at which the most recent sensor glucose level is rising or falling. |


Sensor Graph
In addition to the 3-hour graph, you can also view 6-hour, 12-hour and 24-hour glucose trend graphs. The sensor graph displays your current SG reading that is wirelessly sent to your pump by the transmitter.
The sensor graph includes the following information:
- The most recent SG reading.
- Your historical SG readings for the last 3-hour, 6-hour, 12-hour, or 24-hour periods.
- Your high and low SG limits.
- The bolus deliveries you have given during the time period shown on the graph.
- Any suspend events that have occurred.
Details about correction bolus, BG entry, and carb or food bolus are shown on the graph. To view details for an icon, look for the icon on the graph and press the left and right arrows to scroll to that icon. The details for that icon are located along the bottom of the screen.
Icons shown on the graph are:
 |
Indicates either a correction bolus or manual bolus |
 |
Indicates a BG entered either manually or using a meter |
 |
Correction bolus |
To access the sensor graphs:
From the Home screen, press the Graph button.
A full-screen view of the 3-hour graph appears.- Press Left to scroll back over the graph. Sensor values will be shown at the bottom of the graph.
- Press Up to see the 6-hour, 12-hour and 24-hour graphs.
- Press Back to return to the Home screen.